Innovative
Cutting edge concept of maritime safety
Upload the hydrographic data, add waterways and the public have a web map to sail safely
Cutting edge concept of maritime safety
Upload the hydrographic data, add waterways and the public have a web map to sail safely
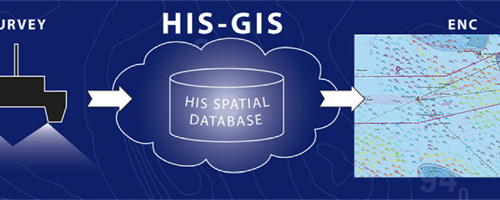
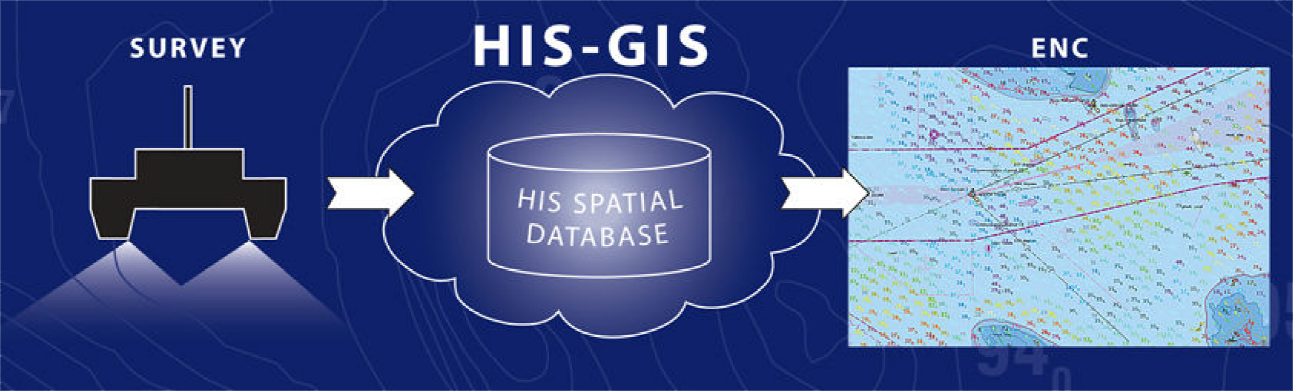
We are prepared to transform your hydrographic data into a web-based Hydrographic Database Management System with GIS tools (HIS).
HIS is an information system for managing and presenting data from hydrographic surveys.
It can also produce high quality fairsheets to simplify the process of the production of electronic navigational charts.
Hydrographers and Cartographers can take decisions based on location information. It is a vital feature considering the constant changing of the underwater situation.
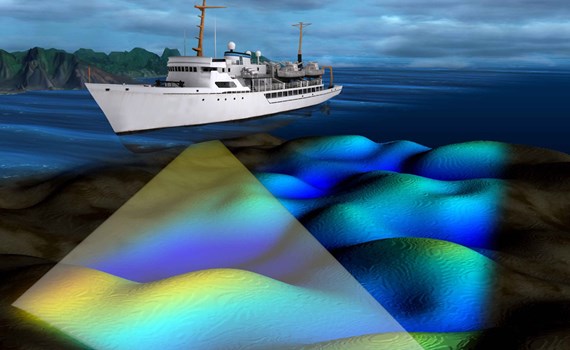
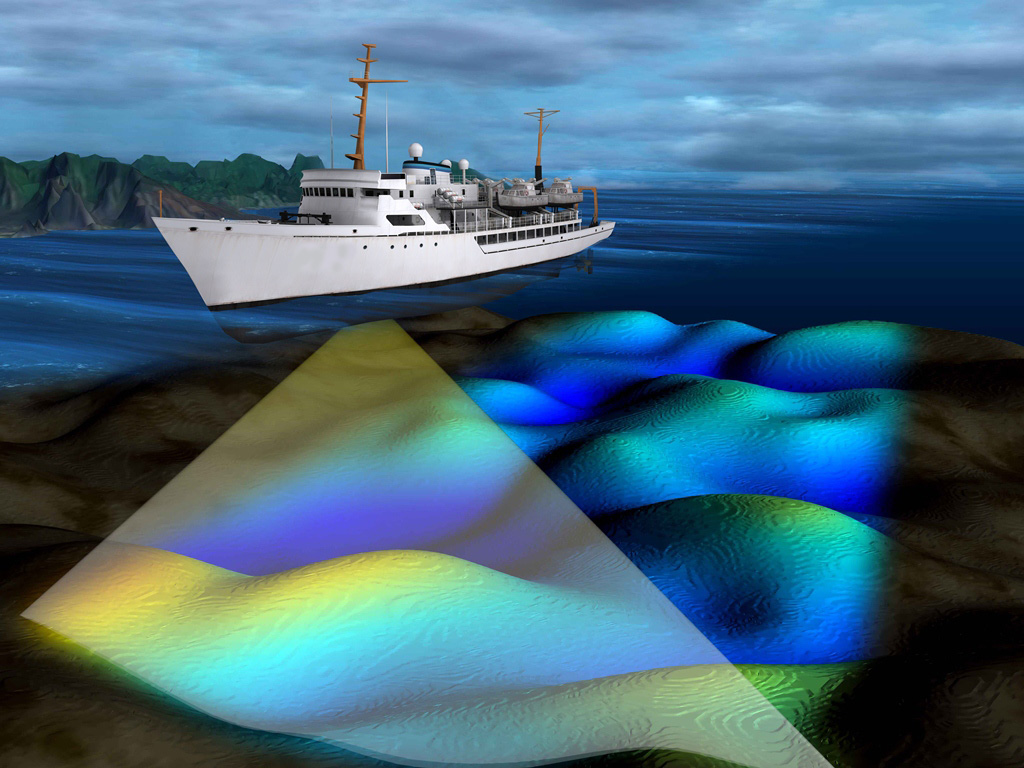
The system consists of two main parts: a seamless database of depths (soundings) and a database of objects. The objects for the system are collected from hydrographic surveys – survey areas, wrecks, navigational marks, rocks and obstructions.
For every object extensive information can be stored in HIS, containing its location, classification and attributes, and also images. HIS also provides a wide range of user-friendly GIS management tools for managing and presenting surveyed data.
Many organizations have a primary responsibility of maintaining authoritative records about the status and change of geography. GIS provides a strong framework for managing these types of records with full transaction support and reporting tools.
GIS is becoming essential to understanding what is happening-and what will happen-in geographic space. Once we understand, we can prescribe action. This new approach to management- managing geographically-is transforming the way that organizations operate.
Extreme reduction of the time and efforts required to create an updated Electronic Map using survey data, assuring the topmost update and control at the same time. Our HIS Solution ensures safety of waterways, computerizing the widest part of the process involved.
HIS is web-based which means, that can use it can be used simultaneously from different geographical locations. Very large amounts of data can be downloaded through the web interface for professional purposes. Cartographers, for example, can order data bundles in different ways and formats.
All survey data together with metadata can be uploaded to HIS and later downloaded for data cleaning or for using in other systems. Metadata can be edited and later exported. The system tracks the status of survey areas, recording who changed the data, what operation did he do and when was it carried out. When an area is processed, its status changes and the change is immediately visible to the other users of HIS.
Information in object database is managed inside HIS, e.g. you can change object type from obstruction to wreck, add additional data from other sources, etc.
All data is visualised on background map. Users can choose from several alternative backgrounds, administrator can configure any WMS-based map service for background. HIS
data – survey areas, sounding points, depth contours and objects – are shown on map background. Survey areas are displayed as thematic maps, either by survey time or by IHO
classification. Navigational marks, wrecks and obstructions are shown in standard S-52 representation.
You can get further information by clicking on objects on the map or by using our powerful query engine. All object types (excluding soundings and contours) can be queried by combining several database fields and logical operators.
You can search the entire database or restrict the query to certain spatial extent. For this purpose a polygon can be defined by entering vertex coordinates, by reading from an external file, or by taking from the database (e.g. a survey area). You can even combine different polygons in one query.
The results from queries can be highlighted on map or exported to different formats.
The process of getting an updated electronic navigational chart (ENC) fraction draft from HIS involves selecting the area of interest and setting the parameters for chart generation:
Fairsheet generation, data suppression, contour generation and final map compilation will be done automatically based on metadata of survey areas. HIS takes into account the properties of overlapping survey areas to ensure that the most accurate and up to date data is selected for processing and exporting.
Fairsheets can be generated from areas up to 400 square kilometers.
Depths in XYZ format can be extracted in resolution up to 1 meter.
The principal aim of Maritime Administration is to ensure safe navigation in territorial and inland waters.