Software environment for analysts and investigators to collect, represent, explore and provide information in an understandable form for the recipient. Depict large amounts of information in a graphic form and represents data by objects and their relationships. Together with the functionality of data analysis, it helps to understand what is happening, to find and identify key figures and events.
Comprehensive investigation software
Analyze and visualize
If you need to
- Gather data from different sources
- Merge fragments to see the big picture
- Find hidden links between suspicious companies, persons and connections out of thousands of phone calls or bank transactions
- Simplify and facilitate the investigation work
- reveal group of terrorists
- fight organized crime
- discover corruption
- prevent child abuse, catch human, weapons or drug traffickers
- solve murder
- trace contacts (eg COVID19)
Visualize
A picture is worth a thousand words. Depicts large amounts of information in a graphic form, where every piece of information is presented by an icon (object’s picture) or link (relation) between objects
Analyze
Intuitive and easy-to-use software environment for analysts and investigators to collect, represent, explore and provide information in an understandable form
Simplify
Not special knowledge of IT is needed. The working environment is simple and understandable; an ordinary user can make all necessary activities without having any IT assistance
you can add data:
- Manually: drag-drop icons on the chart area and defining links between them. It’s reasonable when you need to sketch an idea and the amount of information you have is not too big.
- Import large volumes of information from structured files.
- Find and explore data from internal database(s).
- Receive information into the chart from external data sources
It doesn’t matter where the information is coming from, on chart you will see the picture composed by graphical elements. “Draw” the complex query by using object icons and relations, define conditions to searchable elements, check the result and show it on the chart.
What to do when the chart is looking like a tangle of lines and you are not able to follow up the connections from one object to another?
The find and analysis functions will provide the great help in this situation. You can find and select object(s) of interest, find connected elements and path, define the importance of chart objects within a group or apply cluster analysis. Results can be copied to a new chart and saved for further work or representation to colleagues or
Objects and relations
To create chart and simultaneously save information into database, drag and drop the object type icon to chart area and enter information about a particular object. Populate chart with as many objects as needed. Draw a relation: two objects may have multiple relations and each of them can be described and saved into database.
Every piece of information (e.g. address, meeting, conviction, sale, telephones and calls, bank accounts and transaction etc) can be depicted on the chart.
Layouts
From 8 layout types, choose the best for objects’ arrangement on the chart area. Some of the layouts are indispensable when it comes to relations(e.g. telephone call or social networks analysis), others simplify the understanding of organization structure or organize the representation of relations.
Find path
You know that 2 certain objects are connected to each other indirectly, but can’t follow up all relations between them. Find Path ensures fast finding of the way from A to B, including all what is common for them.
Common neighbour
Sometimes it is very useful to find out what two selected Chart objects might have in common. Select objects, click the button and the result will be highlighted on the chart.
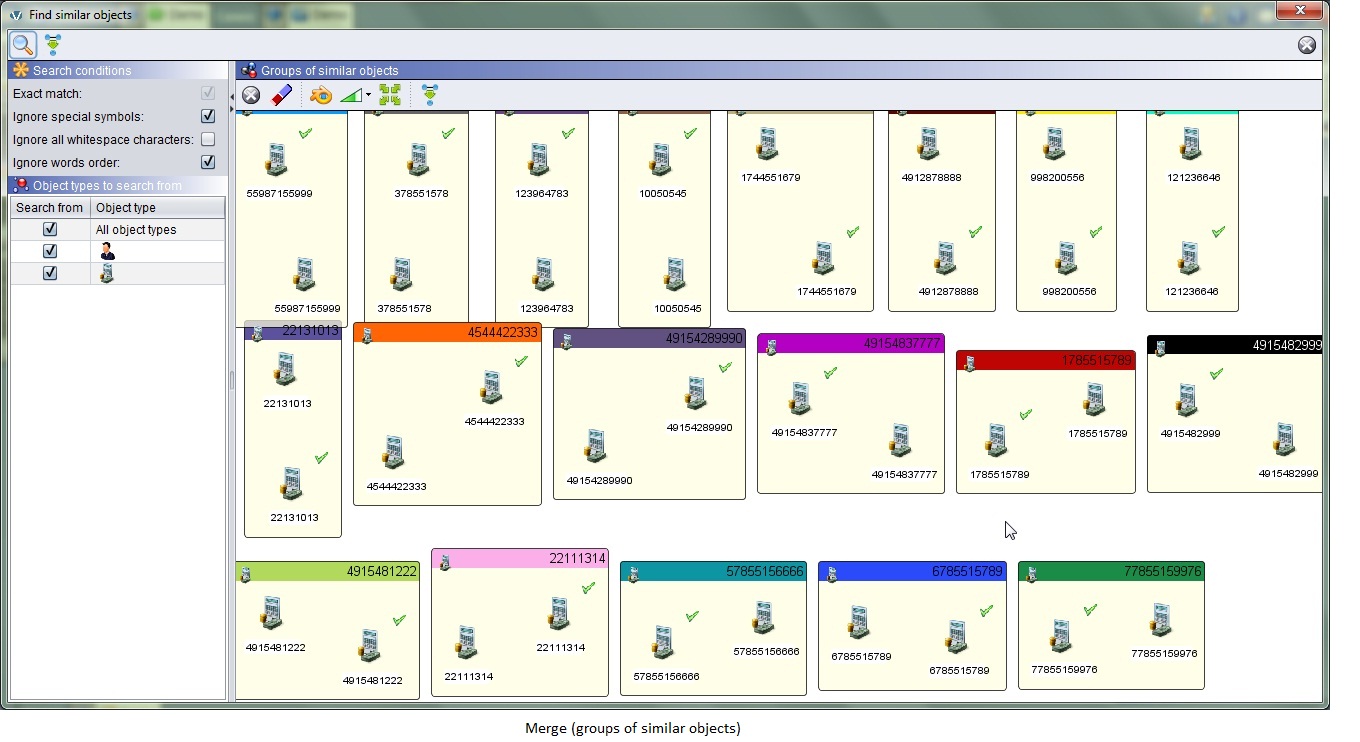
Merge
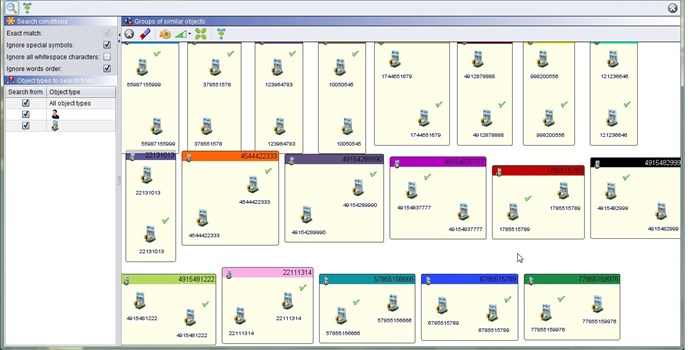
On the chart you have collected data from different sources and you are convinced that some objects are the same, but don’t know which ones. Merge function will find similar chart objects and let you apply necessary action: merge them into one, exclude an object from the group or exclude the group. Choose ignore special symbols or words in order to ensure finding of all similar objects. When merge is done, different fragments will be joined into one picture and you will see existing relations more clearly
Find chart objects
Finding object(s) on the chart is simple: choose between 5 pre-defined conditions, enter the part or full text and hit search. Found chart objects will be highlighted and you can continue working with the result. Visual Search is another opportunity for related objects’ search. It is similar to Visual Query: draw the “picture”, define conditions and the result will be highlighted on the chart.
Network analysis
Within the group of objects(e.g. social networks), some of them are more important than others. It has the function that evaluates all chart elements and yields a double value for each object or each relation. This value directly denotes the chart element’s importance, i.e. the higher the value, the more important the element.
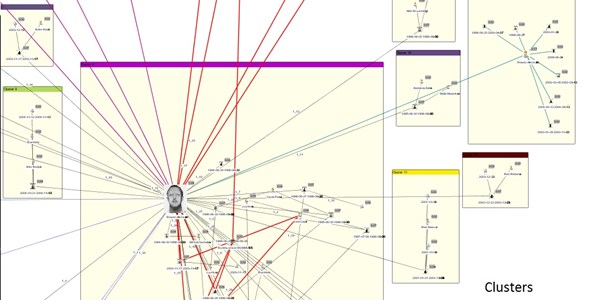
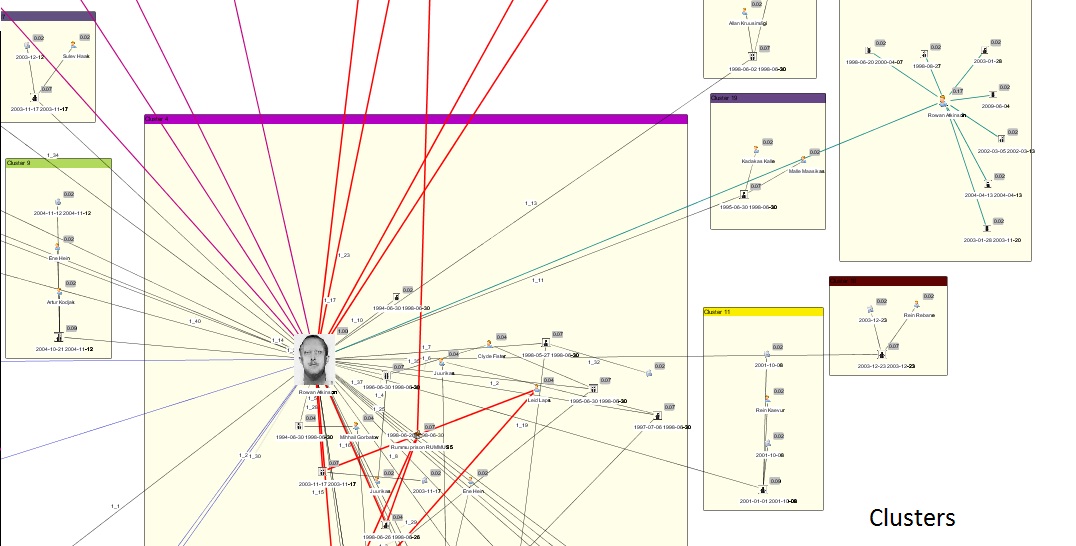
Clusters

When you need to find similar objects and assign them into group, use Cluster analysis function. Objects grouped into the same cluster are more similar to each other than objects in different clusters.
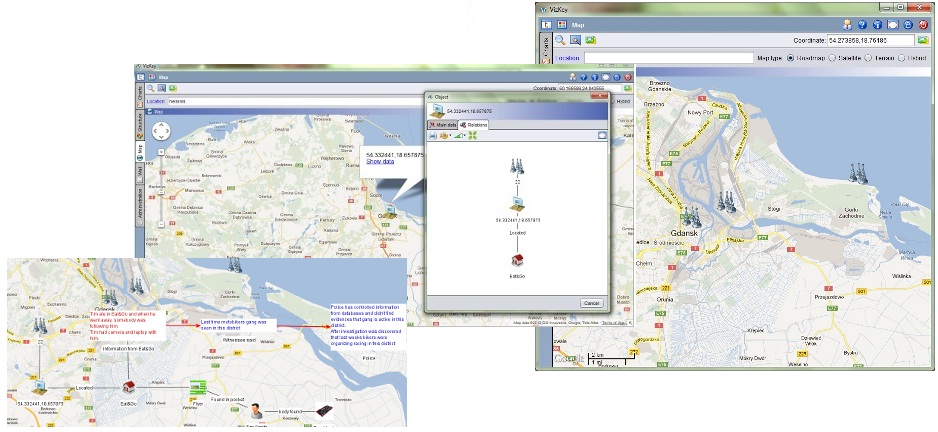
Mapping
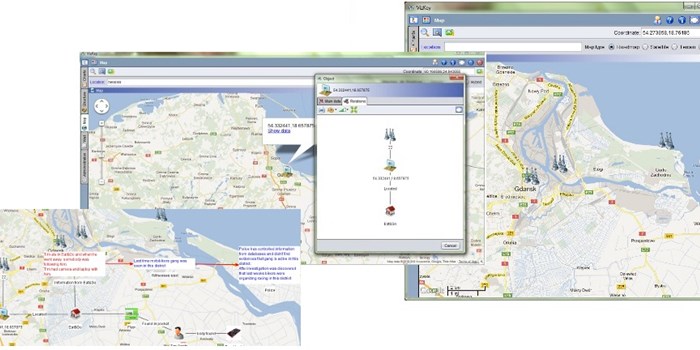
It has built-in integration with Google Maps. Add objects to the map, define the location and copy coordinates into database or use a picture of the map as background image.
You will never have the problem of where to hold collected data and how to combine it with recently received information. Database can be located on a server or a personal PC, be part of Oracle, MS SQL or My SQL database; it has no limits.
Find and explore data from database(s). You will never have the problem of where to keep collected data and how to combine it with recently received information. Database can be located on server or personal PC, be part of Oracle, MS SQL or My SQL database and it has no limits.
You can define various databases with unique structures and for different purposes. Every database can contain multiple cases – happenings, tasks you work with etc; every case is like a folder for several charts – files with working information, ideas, hypothesis or results of investigation.
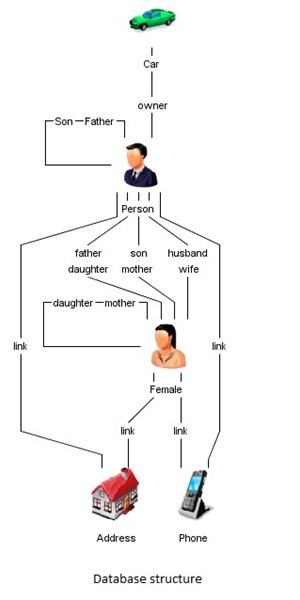
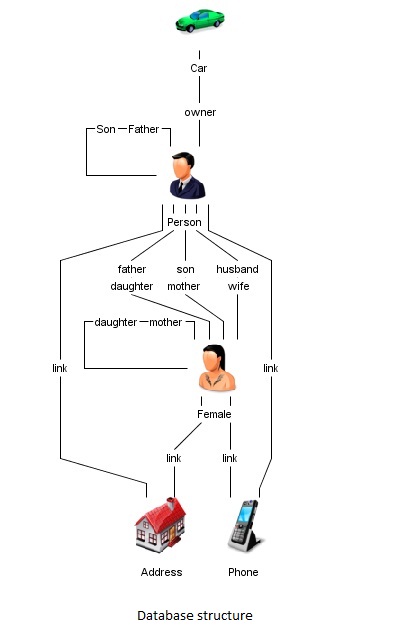
Structure
Running first time you will be asked to create a database and define its structure: create object and relation types to represent information you most likely would work with. It’s simple enough even for an intermediate computer user. Add the General icon on the chart area like when creating a chart manually, name the object type(e.g. Person), choose a picture and add fields for data entry(Name, Last name, Date of Birth etc). When object types are ready, create relations between them and review the structure.
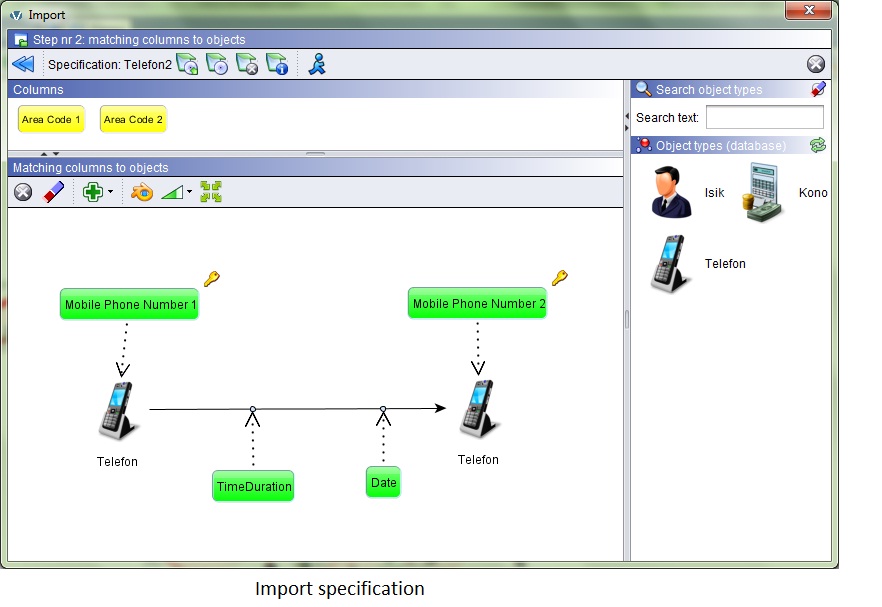
Import
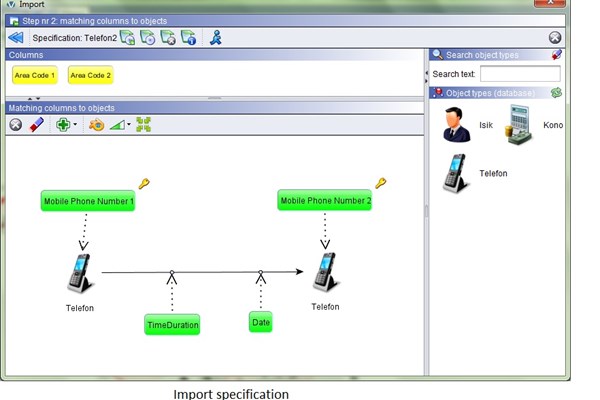
Import large volumes of information from structured files. It makes the life much easier – instead of spending the time and defining every object manually, you can transform a huge volume of information in graphical format within few minutes.
Transfer information from multiple files, detect similar objects, merge them into one and you will see more clearly all implicit relations and activities.
Choose the file, enter the fields’ separator, and choose graphical elements to represent objects and relations on the chart or save them into database. Appoint the name of field(s) to particular object and relation and run import.
Save import templates, to make the process even more faster next time.
Information in database
You can anytime supplement existing chart with information from database(s).
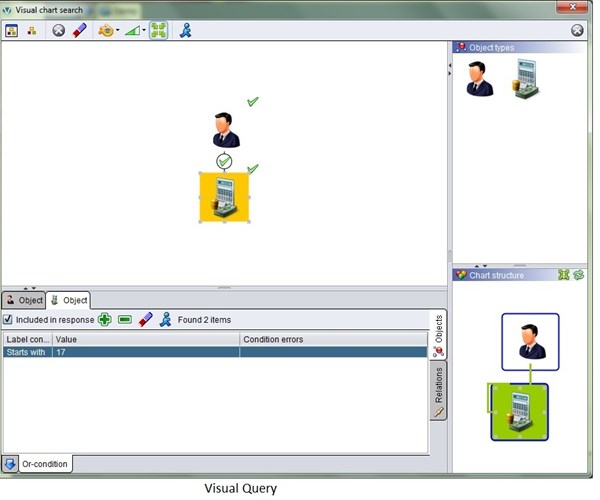
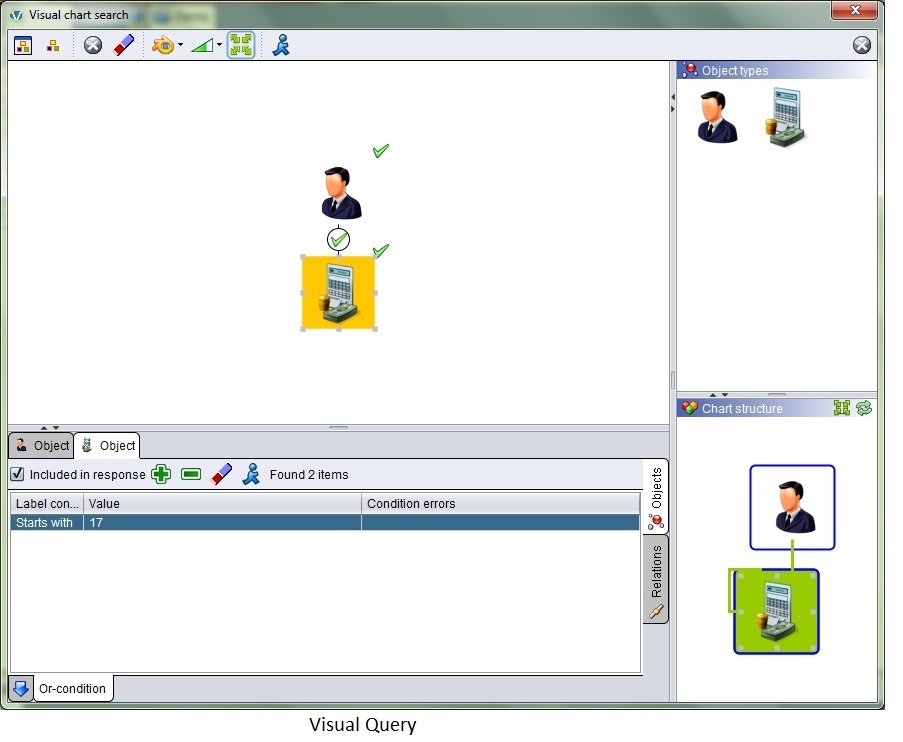
Simple database search helps to find a single or multiple objects compliant with search criteria; complex database query gives out linked objects relevant to defined conditions. Most of functions support information visualization and so does Visual Query. It is very similar to chart creation: drag and drop object and relation types, use AND/OR conditions, specify detailed search criteria and show the result on the chart.
Once the object is depicted, Expand up to 5 levels extracts on the chart additional information about relations entered and stored in database.
choose desktop or client-server version
Multi-user system with a database on a server. In this case database is located on a server, shared between several users and the software is running on user’s computer.
A program for a single user or department. The database can locate on user’s computer and be used by one or several users.
To work with this software the user does not need any special knowledge in IT. The working environment is simple and understandable, an ordinary user can make all necessary activities without having any IT assistance. You just need to run the software installation, define the database and in 15 minutes – it is ready to be used!
If you have never worked with visualization tools, we would suggest taking the training course to understand the principles of database and charts’ creation, become more familiar with Visual Search tools and the product’s functionality.
- Police forces (including prosecutors’ offices)
- National Police forces
- National Defense forces
- Intelligence
- Anti-Corruption Departments
- Financial Monitoring Services
- Border Guard
- Customs
- Tax Departments
- Banks
- Telecoms
- Prisons
- Internal security departments of institutions
- Insurance companies
- Drugs trafficking
- Human trafficking
- Terrorism
- Thefts
- Smuggling
- Internet and Social Networks related crime
- Espionage
- Financial fraud
- Corruption
- Public funds (sickness, …) related fraud
- General criminality and other fields of crime
Licensing
Software is licensed per user: one license – one simultaneous user. The network license is available and the software can be used simultaneously by as many users as many licenses are purchased.
Maintenance
There is no complicated maintenance service for the product. Product updates and upgrades are provided to supported users by developer or local distributor and can be installed by the user having administrator rights on current computer.